
Troubleshoot a bugcheck with WinDBG
WinDBG is a powerful tool for debugging PE (Portable Executable) files, namely executable process ones (file extension being .exe) and performing reverse engineering. WinDBG depends upon PDB (Program database) files which are basically debug symbols in order to fully properly use the tool. WinDBG can be acquired separately from Windows SDK without having to install the whole SDK. You can get it from here.
I'll be using Windows Server 2003 as the OS target to simulate a bugcheck. Before we dive into that, make sure that you set up the symbol path. To do so, go to File > Symbol File Path
and paste the following if you haven't done it.
SRV*C:\path\to\symbols\*http://msdl.microsoft.com/download/symbols
I'll explain briefly the syntax and semantics behind this. SRV* informs WinDBG that the PDB symbols must be gathered from a symbols store, an Internet connection is required for
such procedure. C:\path\to\symbols\ is the destination path where you want to store the downloaded symbols in, it's entirely up to you where you want to store them. And finally,
http://msdl.microsoft.com/download/symbols is the symbols URL store where WinDBG will ping the said symbols store and download the PDBs from there. Now it's the time to get started!
In this process I'll be simulating a IRQL_NOT_LESS_OR_EQUAL bugcheck. The command window of WinDBG should look like this:

What I exactly did to get IRQL_NOT_LESS_OR_EQUAL? I added an offender call, PsChargePoolQuota, with an invalid POOL_TYPE value within a kernel mode driver. The function
will write beyond the paged and non paged memory areas thus writing garbage data into the kernel memory space. Windows is not yet aware of this as it hasn't yet accessed such
garbage data in the memory. This later happens when trying to overwrite the files of the kernel mode driver (whilst not in execution!) from a shared folder.
🢂 Obtaining and analyse a call stack
A call stack is a stack which stores the routines and subroutines recently executed by the processor. Prior the system gets into a fatal crash the system captures the last
called functions and puts them into the aforementioned stack. To get the information of the call stack backtrace, type kp in the command line within the "Command" window or just
open the Call Stack window. WinDBG should look like this either way:
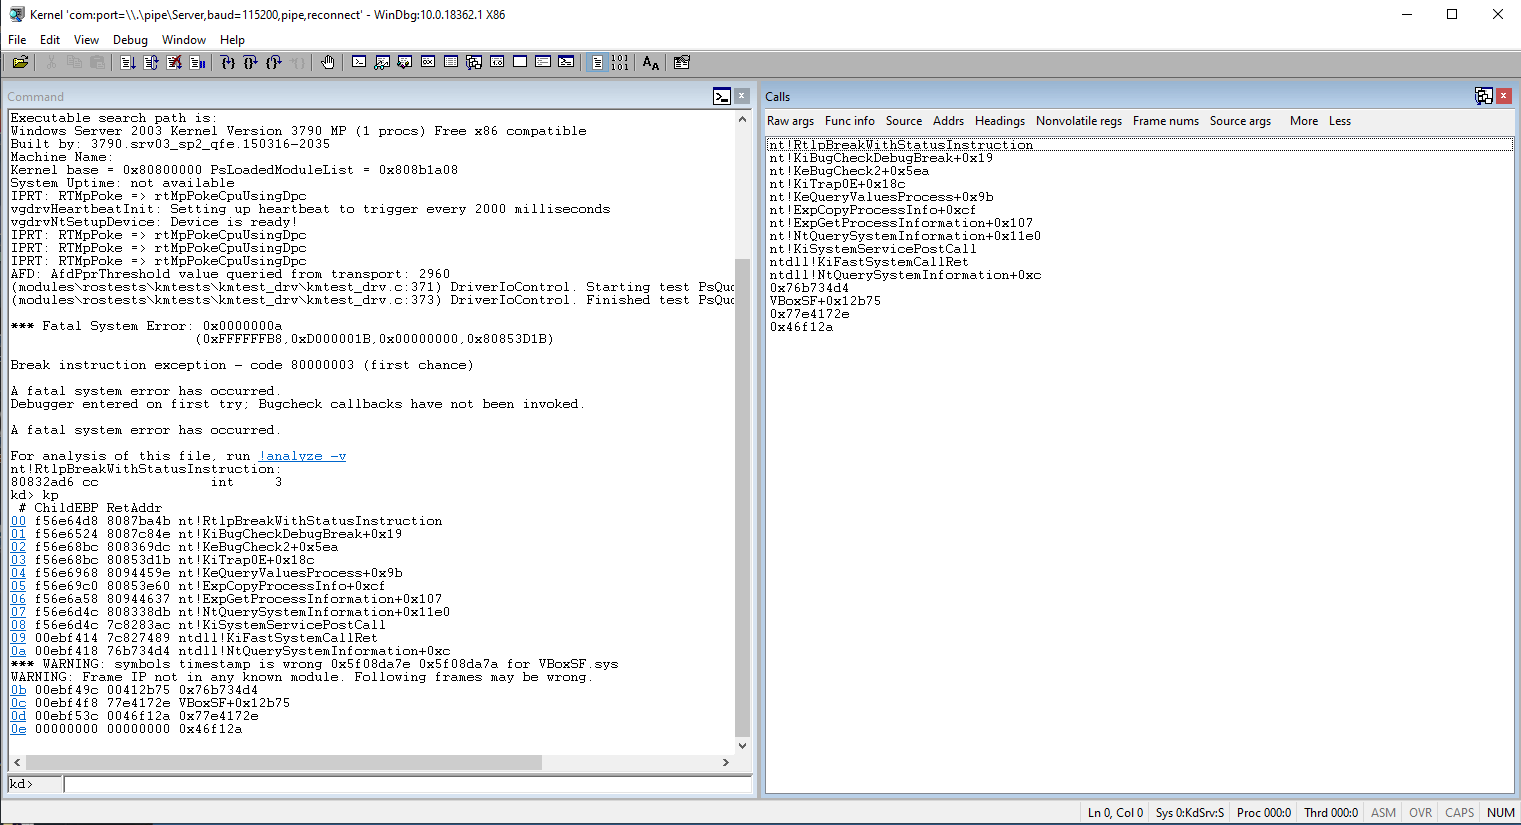
As you can see, Windows has caught a page fault and the operating system is instructed to take special care of this situation and it does that by calling KiTrap0E. That
function is responsible for handling page faults with the hope of recovering the system but as it turns out, the exception trap handler couldn't be able to proceed further. The interrupt
request level (IRQL) wasn't at PASSIVE_LEVEL at the time of execution which means the interrupts with ranking level not above or the same to DISPATCH_LEVEL were masked, therefore,
the system was determined to bugcheck itself. But why's that?
As I stated above, the bugcheck occurred when I tried to overwrite the files of the kernel mode driver from a shared folder. The problem goes way deep down to the VirtualBox service process
and because of that the system wanted to read some corrupt data from a certain address pointed by the first parameter in the bugcheck. Such operation led to the phenomena of a page fault and
within this condition the IRQL wasn't changed. If we are trying to narrow the actual fault by using ln which points the nearest symbol pointed by the 4 parameter of the bugcheck
which is, as usual, the function call triggered at the time of the fault.

The memory manager tried to map corrupt memory data at a different IRQL and the exception handler was invoked to handle such page fault.
🢂 Getting verbose details
Using the !analyze -v command gives you the opportunity to get verbose information about the current instance of a bugcheck. The command window should look like this:
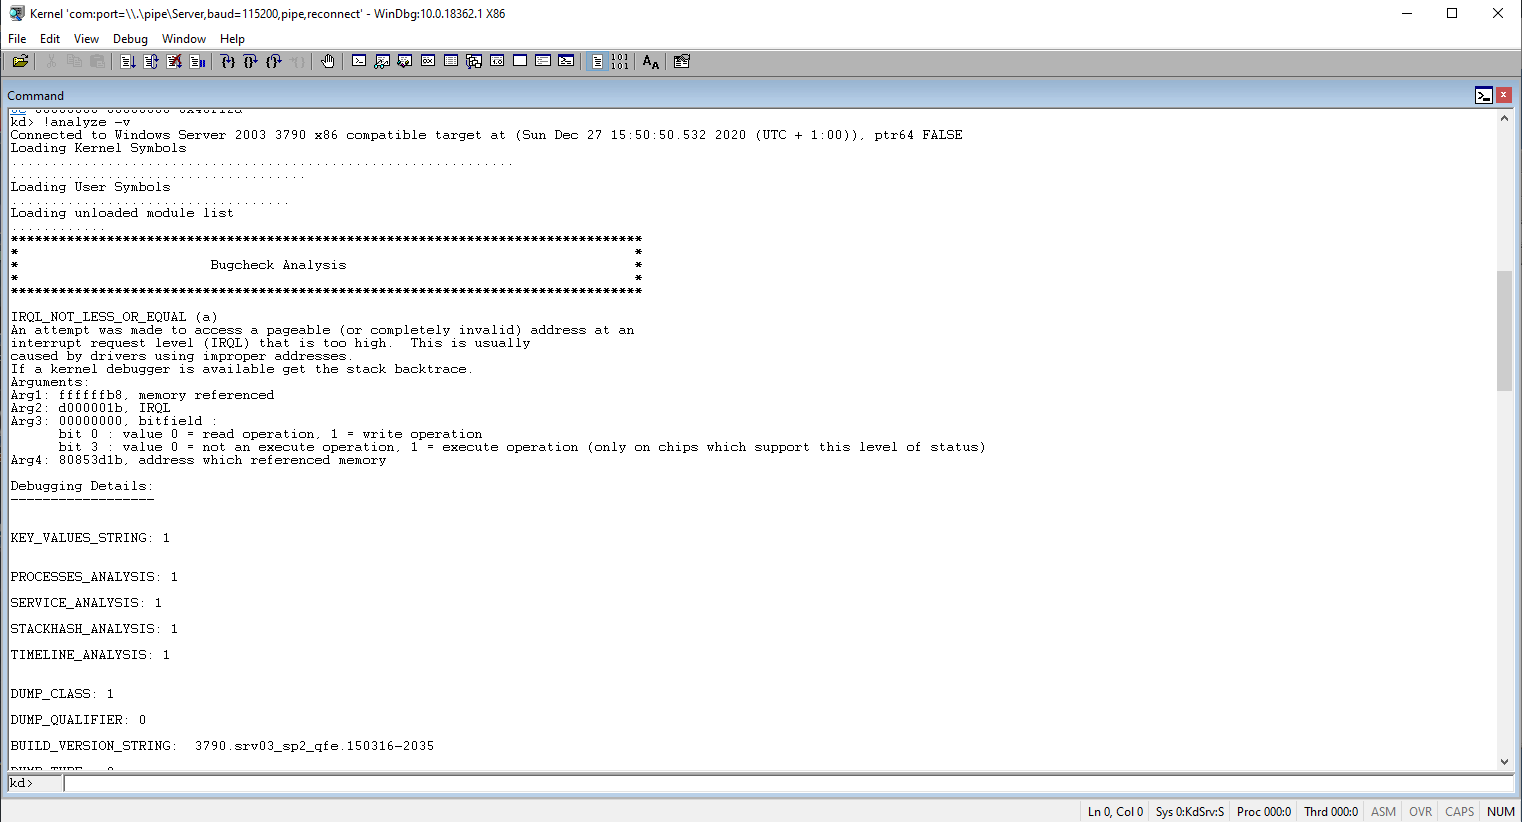
Obviously I would not be going to review every detail provided by the command so I will explain only the important notes that are worth noting.
BUILD_VERSION_STRING -- Build version string of the operating system.
BUGCHECK_P1, BUGCHECK_P2, BUGCHECK_P3, BUGCHECK_P4 -- Bugcheck parameters.
READ_ADDRESS -- The read address (if given) at the time of the bugcheck.
CURRENT_IRQL -- Current interrupt request level at the time of the bugcheck.
FAULTING_IP -- The faulting instruction pointer at the time of the bugcheck. The IP is a CPU register that instructs the processor to execute the next code instruction pointed
by an address.
CPU_COUNT, CPU_MHZ, CPU_VENDOR, CPU_FAMILY, CPU_MODEL, CPU_STEPPING -- Properties of the processor.
PROCESS_NAME -- The name of the process at the time of the bugcheck.
TRAP_FRAME -- The trap (exception) frame captured prior the bugcheck. This frame is useful as it points to the thread which the fault occurred.
STACK_TEXT -- The call stack.
MODULE_NAME -- The module name of the image file which the bugcheck occurred.
IMAGE_NAME -- The image name which the bugcheck occurred.
